
Environmental statistics
We have implemented several projects for the European Commission (DG Eurostat). Eurostat, is the statistical office of the European Union, housed in Luxembourg. The task of Eurostat is providing statistics at European level that enable comparisons between countries and regions as possible.
Environmental pressure indicators and indices for the European Union
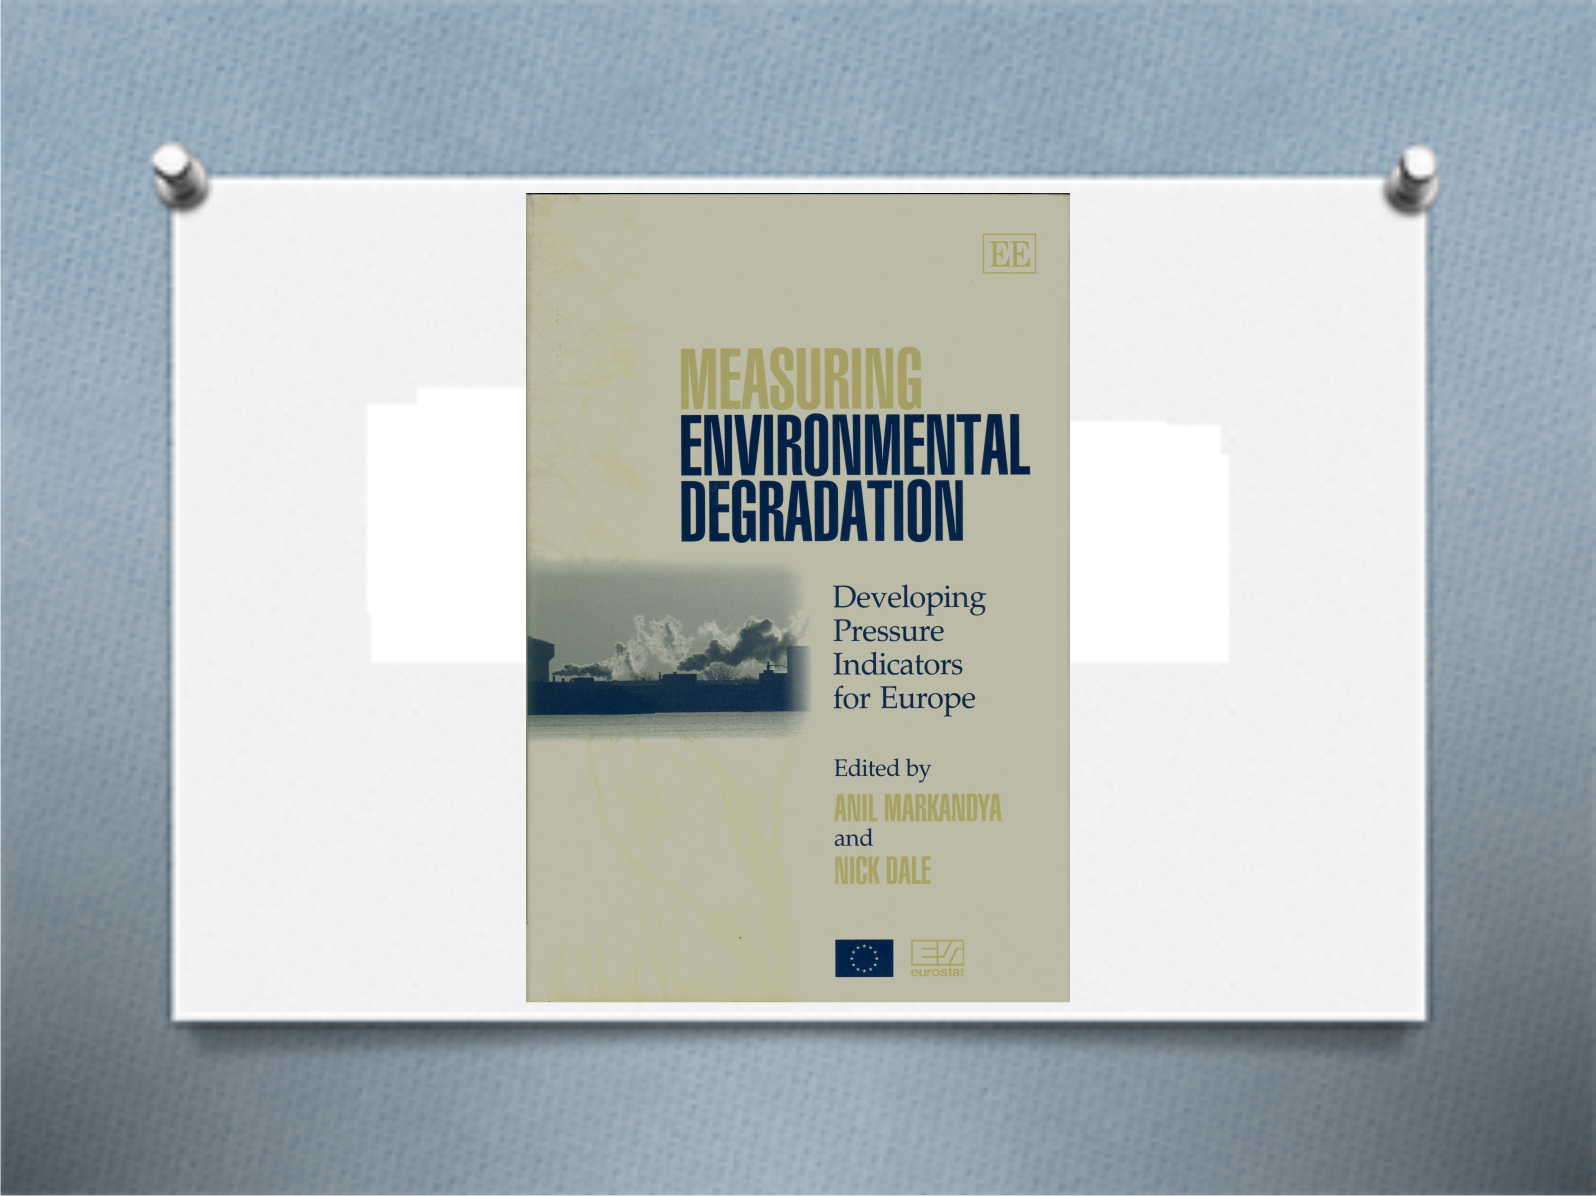 Defining indicators for depletion of Natural Resources. As part of this project, we have also contributed to the book "Measuring Environmental Degradation" (Edward Elgar Publishing 2001).
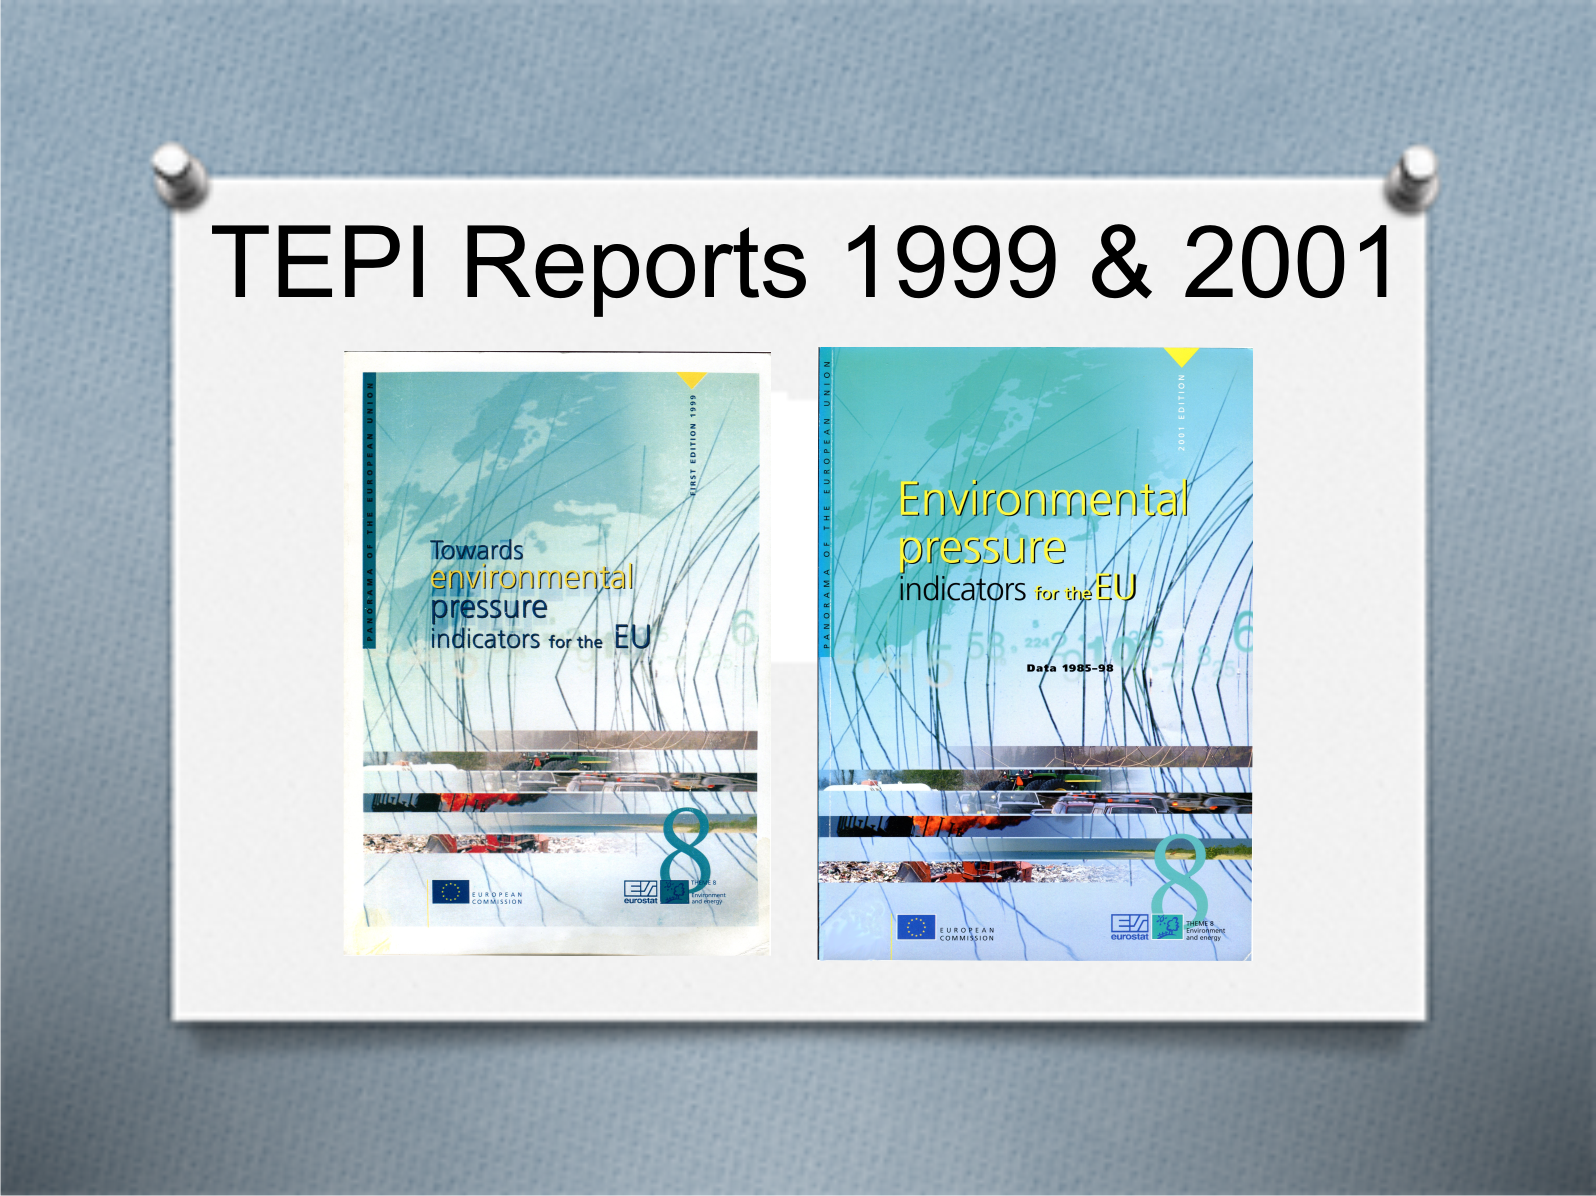
- Publication of an 'early harvest' report of six indicators for each of the 10 European environmental themes (Natural Resources, Water, Distribution of Toxic Substances, Water Pollution, Marine Environment and Coastal Zones, Depletion of the Ozone Layer, Climate Change, Air Pollution and Urban Environment). This report is published under the name "Towards Environmental Pressure Indicators for the EU - First Edition 1999" (TEPI). Very special and interesting about this report is, that for the first time meta indicators were included to depict the quality of the indicator itself for each of the criteria:
- 'Relevance' (of the presented indicator with respect to the policy question to be answered);
- "Accuracy" (comparability of data, reliability of data sources, coverage, reliability of the underlying methodology, relevance of breakdown);
- 'Comparability over time (completeness and consistency of the time series of the underlying data sets) and
- 'Comparability in space' (number of Member States represented in the indicator, geographical coverage and reliability of the data within the country data, differences in methodology between the Member States).
Such 'NUSAP'-like approach had not previously been included in a paper from the European Commission.
- Publication of a more detailed report on 10 European Environmental themes, supplemented by data on the causes of environmental problems: the economic sectors.
Indicators of environmental integration into EU sectoral policies
 We supported Eurostat in devising and making various indicators of integration of environmental concerns into sectoral policies for:
- Transport (Transport and Environment Reporting Mechanism - TERM),
- Agriculture (Agri-environmental indicators Nutrient balance sheets, Evaluation of the TAPAS reports),
- Energy and
- Water.
Many of the Agri-environmental work is carried out in close collaboration with the OECD.
EU Indicators for Sustainable Development
Our contribution to the environment-relevant indicators of the EU Sustainable Development Indicators was to develop quality profiles (metadata) for these indicators.
Streamlining of European Environmental Indicators
As part of the Shared Environmental Information System (SEIS) of the European Commission, the "Group of Four (DG Environment, EEA, JRC and Eurostat) recognized the need to come to streamline the various sets of environmental indicators which are used in Europe, especially those of the European institutions, the OECD and the UN.
European policymakers rely heavily on analyses based on data from very different sources. Therefore it is essential for the EU to have a system that offers the latest information and a communication technology allows for decision-making at all levels (local to European) with up-to-date environmental data.
This requires an improvement in the manner in which environmental data are now collected, analyzed and communicated. The need to improve cooperation between agencies and better interaction with concerned citizens formed the basis for the establishment of a Shared Environmental Information System (SEIS).
Problem description
 Many environmental (and sustainable development) indicators have been developed in the course of time, each with their own objective and intended audience. Over time, however, it became more and more impossible to see the forest for the trees. Sometimes two indicators have the same name, but represent something completely different. Other indicators are more or less the same, but have totally different names. There is a nexus between the indicator sets, where indicators from one set of indicators are sometimes re-used in another set, often with the necessary adjustments made to the already highly aggregated indicator itself instead of the constituting data sets. Without an overarching system of metadata and QA/QC this is a perilous development. Garbage in becomes garbage out without the possibility to detect this.
Project assignment
The project assignment was a double one:
- Cut the undergrowth. Harmonize the naming of the indicators and collect or produce the metadata to an adequate level for all indicators.
Make it easier for the user to choose the appropriate indicator for the right application. - Design and implement a comprehensive quality system, which includes the ability to streamline the production of the indicators (faster, easier, less costs).
Project results
From 10 indicator sets (AEI, CEI, CSI, EERM, EPI, SDI, SEVI 2010 SI, ISD and TERM) 435 environment (relevant) indicators were identified as potentially streamlineable. For all these indicators, the existing metadata were collected, enhanced and supplemented by additional documentation, interviews, etc. Next, a method was devised in which the indicators were clustered and each cluster has been assessed as to their potential for streamlining.
Project recommendations
-
Where different data sources are used, almost identical indicators should be chosen as far as possible using the same data source. Pick one, or integrate the sources into a single source.
- Where common resources are used for various indicators, a (re)distribution of tasks should be considered to avoid duplication, differences in methodology and confusion over intellectual property.
- This means that producers of indicators should possibly agree on a (re)distribution of tasks among them.
- Apply a common management system for naming or coding and for metadata. This system should be publicly available, so that all users can inquire further.
- Develop separate metadata about the why and how of the manner of presentation of the indicators (popular names, graphics, etc.)
- Install indicator quality teams within- and between the relevant organizations and provide job descriptions, sufficient mandate and a fixed budget and time allocation.
- Set procedures for amendment of existing indicators, and document decisions. These procedures should have a TQM approach, in other words, quality should also be applied to- and demanded from third-party data.
- Create an indicator management organization.
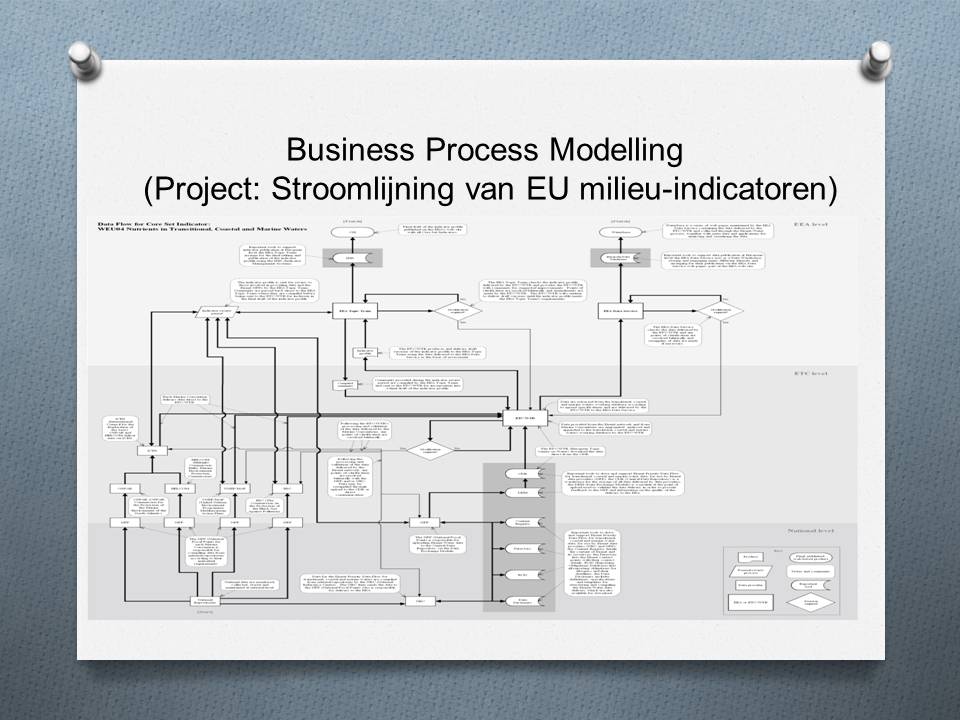
- Using Business Process Modeling (BPM) software to make a complete overview of all the steps in the process from data to indicator. At every stage, ownership of the data, consumed amount of time and labor and costs shall be made explicit and included into the system. In this manner, the route can be calculated which leads to the least cost of production, or which the fastest. This can be done for individual indicators, but also to groups of indicators. In this manner streamlining results in faster and cheaper production of the indicators.